

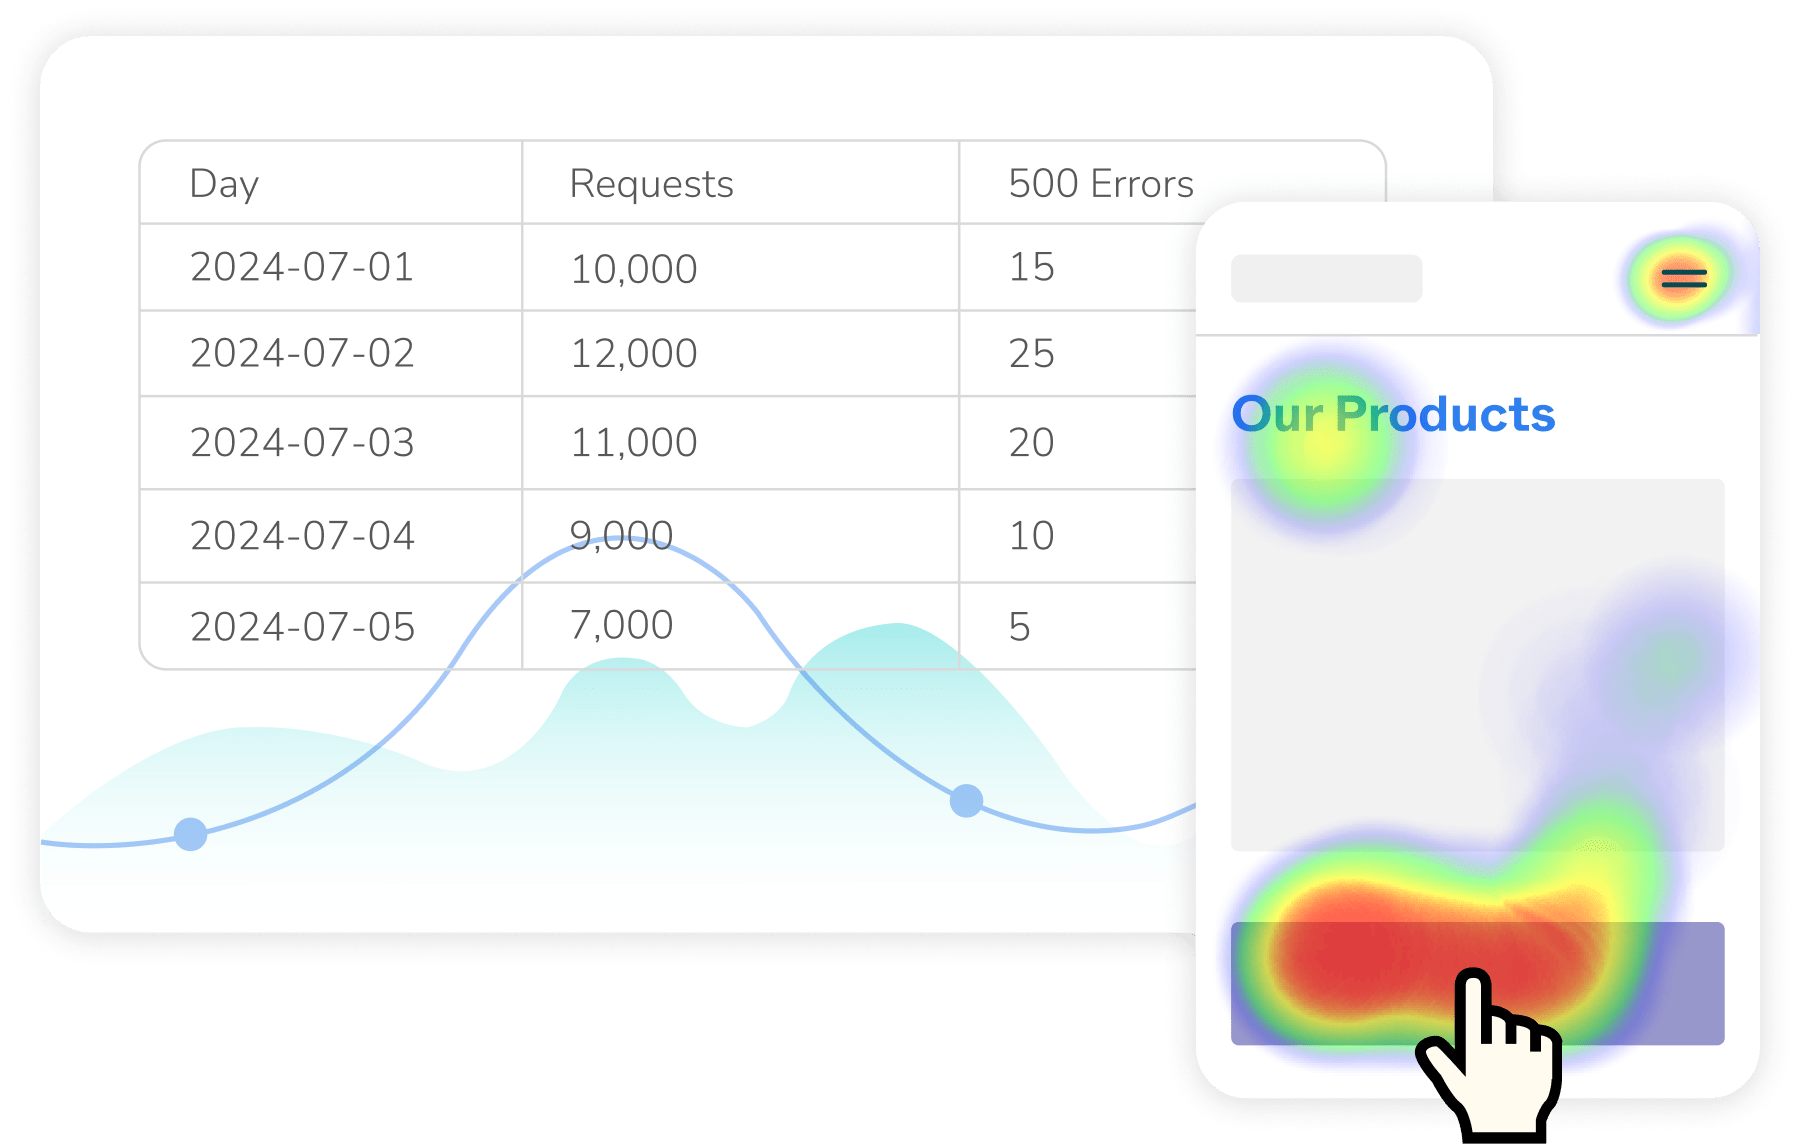
A Product Manager celebrates skyrocketing engagement, unaware of server crashes. A UX Designer dismisses a seemingly unpopular feature based on heat maps, not realizing it's driving significant user retention. Marketing cheers record-breaking Black Friday sales, missing the increase in returns and chargebacks. Customer Support sees an increase in negative reports after the latest update, but can’t understand why.
Welcome to the world of fragmented data insights.
As scale-ups grow, they face a critical challenge: bridging the divide between easily accessible “front-end” analytics and the more complex data from backend systems and third-parties integrations. While front-end analytics tracking does provide crucial metrics, the full story often lies buried in databases, system logs, and external systems, inaccessible to the wider organization.
At Whitespectre, we've partnered with diverse scale-ups - from IoT dog collar makers to health wearable manufacturers - to tackle this data disconnect. In this article, we explore key strategies for when and how to create more comprehensive data ecosystems that empower growing businesses.
Understanding the Analytics Spectrum and Divide
Readily-accessible analytics tools, most notably Google Analytics, are typically the first tracking a company will implement. They’re low effort early on, often requiring just a code snippet and a small amount of event tracking work. They illuminate valuable data like users, sessions, events, page views, traffic patterns and of course the straightforward conversion funnels and ecommerce metrics. They come with appealing, out of the box dashboards, and give everyone a feeling of clarity- at least initially.
However, this easily obtained data only tells part of the story. Behind the scenes, backend systems generate a wealth of more nuanced information, such as-
- Server logs: Detailed records of system events and errors
- API call details: Insights into how different parts of your system interact
- Database queries: Information on data access patterns and performance
- System performance metrics: CPU usage, memory allocation, and response times
- User session data: Detailed breakdowns of individual user journeys
- Finance and accounting data, including insights on returns and customer lifetime value
This backend data is essential for identifying bottlenecks, optimizing product performance, and truly understanding the user experience and behaviors. For example, combining frontend user flow data with backend performance metrics can reveal how system latency impacts user behavior, providing a more complete picture of the user experience.
Yet, despite its value, this backend data often remains inaccessible to those who could most benefit from it.
The Data Access Dilemma
For companies that haven’t invested in a strategy to make their backend data accessible, the ad-hoc process often looks something like this:
- Facing an important decision or issue, stakeholders and product managers realize they’re missing a critical piece of backend data.
- They formulate a request for specific information, often without fully understanding the nuances of the data or technical effort involved in getting it.
- Then, negotiate with the development team to prioritize the request, among other pressing tasks.
- Then, wait for an indefinite period for anything other than urgent requests.
- Finally, they receive a large, static dataset, without documentation, that may or may not answer the original question and may already be outdated.
Overall, this process can lead to missed opportunities, delayed decisions, and an environment where data reviews are seen as burdens rather than opportunities for insight. Yet organizations often persist with it because it’s “business as usual”. Sometimes it’s hard to see when the scales have tipped from ‘being lean’ to ‘being inefficient’.
So how can scale-ups with competing priorities know when it’s time to invest in better data accessibility?
When to Invest in Comprehensive Data Solutions
Initially, many scale-ups try to ‘patch’ the data gap by building simple graphs and dashboards for backend data to complement their frontend analytics. However, as departments and information volumes expand, this method becomes unsustainable, with ad-hoc data requests continuing to pile up for the engineering team.
Despite this, companies often struggle with knowing exactly when to invest in a more comprehensive data solution that would free up developer time. To address this, we've found a simple tactic: tracking all development efforts related to data requests during each sprint, including developer time spent on meetings and conversations. This often reveals that significant resources are already being spent in this area, making the case for a new approach.
Beyond looking at what % of time your team is spending on data requests, here are three other evaluation points to drive the conversation around when to invest in a more comprehensive data solution:
- Decision-making is consistently delayed by X days/weeks due to data access issues and relying on dev data pulls.
- You've identified X missed opportunities or incomplete analysis situations in the past quarter that would have been solved with better data access.
- The data requests backlog itself, plus the gap between that and what the company would want, if those initial requests were getting fulfilled.
Questions like these help stakeholders justify the timing and investment by demonstrating the potential for increased efficiency and better decision-making across the organization.
Scaling Up: Navigating the Data Solution Crossroads
Our strategy for scaling up data solutions involves:
- Ongoing strategic conversations with partners about their data needs and scalability.
- Recommending third-party tools for rapidly growing companies with unpredictable future data needs.
- Developing custom-built solutions for partners with complex requirements or clearly defined long-term information needs.
The key is continuously evaluating data strategies, weighing immediate benefits against long-term scalability. Whether using third-party tools or custom solutions, our goal remains consistent: creating an information ecosystem that grows with the company, providing intelligence without burdening your development bandwidth. This approach allows companies to start small, build momentum, and drive broader adoption as they demonstrate the value of comprehensive data solutions.
Breaking Down the Silos: A Progressive, Iterative Strategy
In our partnerships, we've observed that for scale-ups looking to bridge the data gap, starting small with an eye towards scaling leads to early wins and sustainable practices long-term. By contrast, organizations that start with big-bang or ‘all or nothing’ approaches often get blocked when faced with competing priorities.
So here’s our roadmap for getting started:
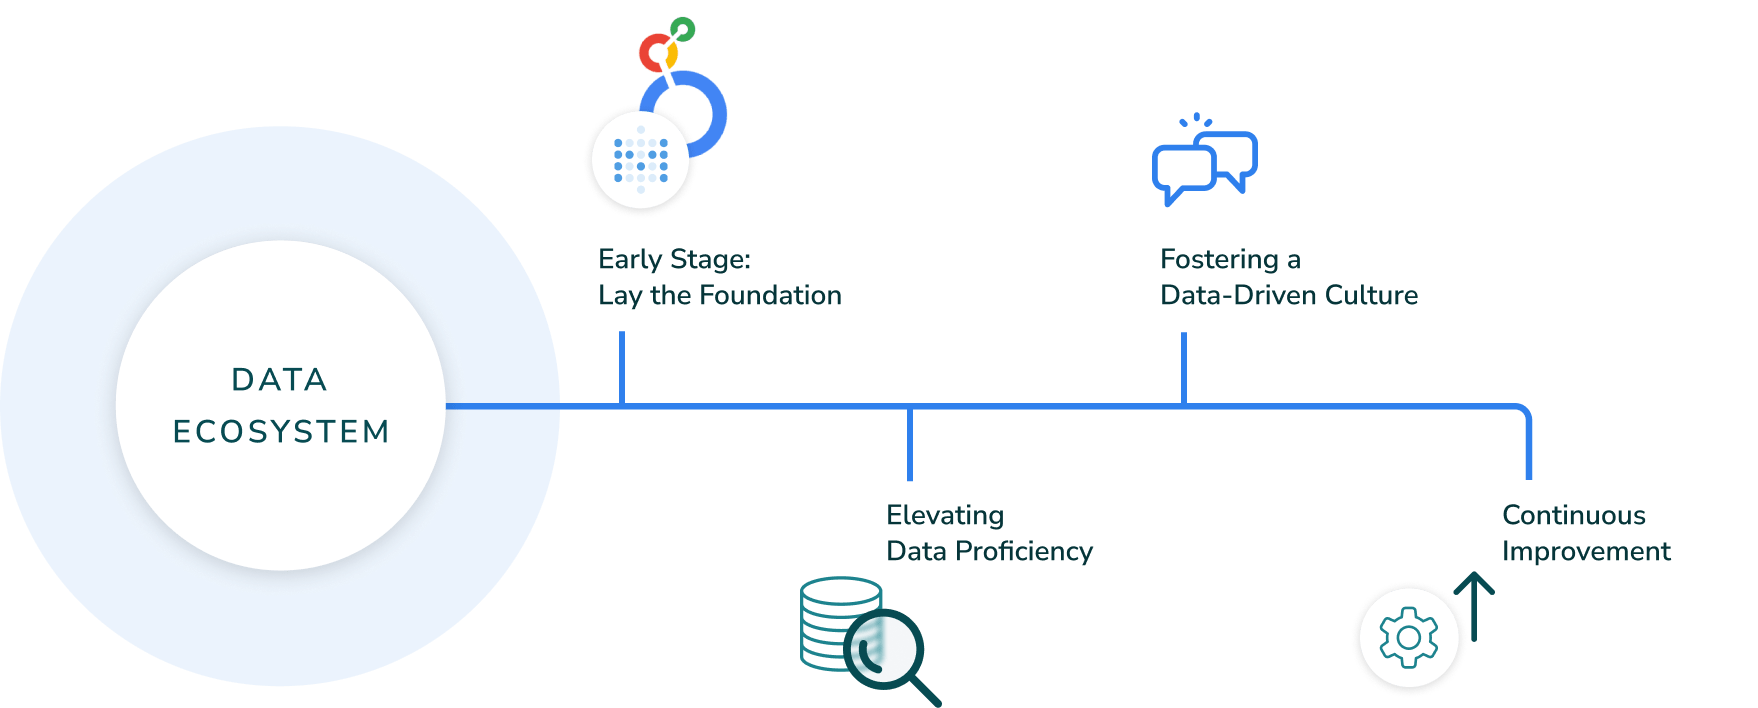
Stages to Bridge the Data Divide:
1. Early Stage: Lay the Foundation
- Conduct a group audit to document all the backend data sources, current access methods (including dev-facing tools and in-house dashboards), and the most common queries/dev requests.
- Implement lightweight analytics using tools like Metabase or Looker with a follower database to avoid affecting the main database performance.
- Prioritize what matters most, and resist the urge to address everything at once. Mark success as achieving clear dashboards and enabling common queries for the most critical data points.
- Identify your core team of early users and develop data access guidelines, ensuring security alongside accessibility.
2. Elevating Data Proficiency
- Train non-technical team members to do self-service for simple queries, regularly checking in on efforts and feedback.
- Create an easy-to-access, living data dictionary, so everyone stays aligned on the exact definitions for metrics and events.
- Continue to involve developers for more complex queries, balancing self-service with expertise.
- Have a shared list of requests and needs not handled by the current solution to inform the future roadmap.
3. Fostering a Data-Driven Culture
- For the wider group, hold purpose-driven data sessions showcasing insights tied to specific business needs.
- Provide contextual training with workshops aligned to real-world challenges.
- Celebrate data-driven wins, recognizing and rewarding data-informed decisions.
4. Continuous Improvement
- Regularly reassess data needs as the company grows, including department staffing
- Maintain a roadmap and dedicated allocation for the tech team to invest in data tools, even if initially small
- Stay flexible, and be prepared to scale your data strategy when necessary.
Key Principles:
- Focus on accessibility, speed, and reliability.
- Avoid over-engineering before understanding real needs.
- Make data an ongoing conversation, not a one-time project.
- Start small, focus on value, and evolve as you grow.
Conclusion
Bridging the divide between front-end analytics and backend data is crucial for growing scale-ups. The goal isn't perfection from day one, but a progressive approach that delivers quick wins while building the foundation for a data-driven culture. Start small, focus on high-value insights, and evolve your data strategy as your business grows.
At Whitespectre, we've seen how this progressive approach eventually empowers teams to make more informed decisions at every level, turning previously fragmented information into a powerful strategic asset. And as more AI-driven analytics tools emerge, we believe that companies who invest in making the full spectrum of their data accessible will be even better positioned to uncover otherwise hidden insights.